ER Diagrams Explained with Examples
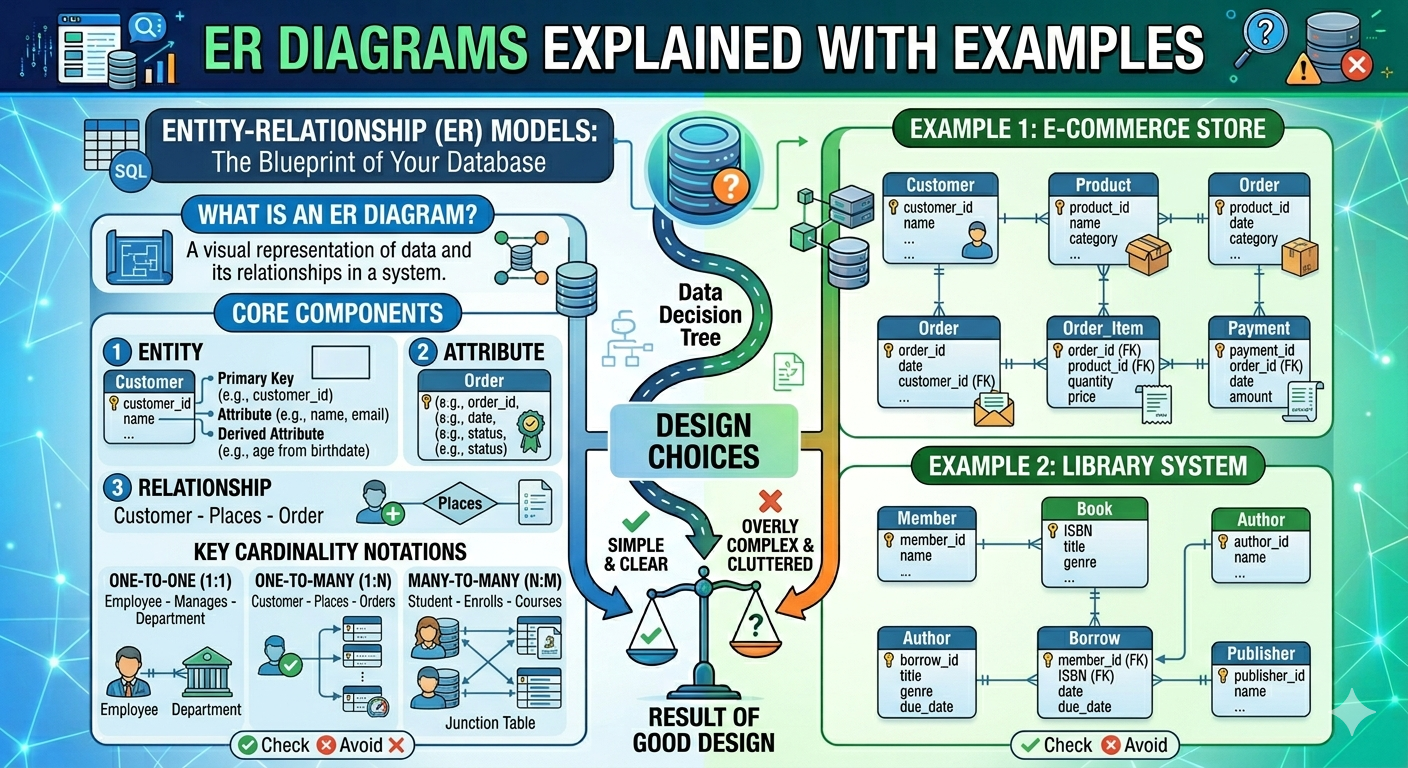
The Entity-Relationship (ER) Diagram is a critical tool in database design. It represents how data is arranged in a system, including entities, attributes, and relationships between them. ER diagrams assist developers and stakeholders understand a database's structure before it is deployed.
Whether you're developing a web application, a mobile app, or an enterprise system, ER diagrams are essential for designing efficient, scalable, and well-organized databases. They serve as a blueprint for database creation, reducing the chance of design errors.
What is Entity-Relationship (ER) Diagram?
Entity Relationship Diagrams, sometimes referred to as ER Diagrams, ER Models, or ERDs, are a sort of structural diagram used in database architecture. The key entities included in the system scope as well as the interactions between these entities are both visually represented by an ERD's various symbols and connectors.
An ER diagram (Entity-Relationship diagram) is a visual representation of a database structure that shows entities (objects or concepts), attributes (properties of entities), and relationships (how entities are connected). It is typically used in the early phases of database design to efficiently organize and communicate data structure.
A process or system's relationships between individuals, things, or concepts are depicted in an entity relationship (ER) diagram. Entity diagrams are frequently used for mapping and modelling in software engineering, corporate information, education, and research. An ER diagram, for instance, can be used by a developer to display the data paths in a relational database and the system flow. They resemble a data structure diagram in appearance (DSD). ER diagrams demonstrate the relationship between entities, while DSDs show the relationship of elements within entities. ER diagrams therefore serve a very different function than organization charts.
ER diagrams use symbols to convey information: rectangles represent entities, ovals denote attributes, diamonds indicate relationships, and lines connect entities. These symbols enhance diagram readability and comprehension.
Key Components of ER Diagrams
Entity
Attributes
Relationship
Primary Key
Primary Key cannot be Null.
Primary Key Values must be unique.
Primary Key must be given a value when the new record is inserted.
Rarely Should the primary key values be changed.
Foreign Key
A database's structure includes foreign keys as a common element connecting two tables. A primary key located elsewhere must always be cited by a foreign key.Better Understanding of Data Structure
ER diagrams are a clear visual representation of how data is structured within a system. They help developers and stakeholders understand how different pieces of information are connected by displaying entities, attributes, and relationships. This visual method simplifies complex database structures and allows everyone involved to immediately understand the overall architecture.
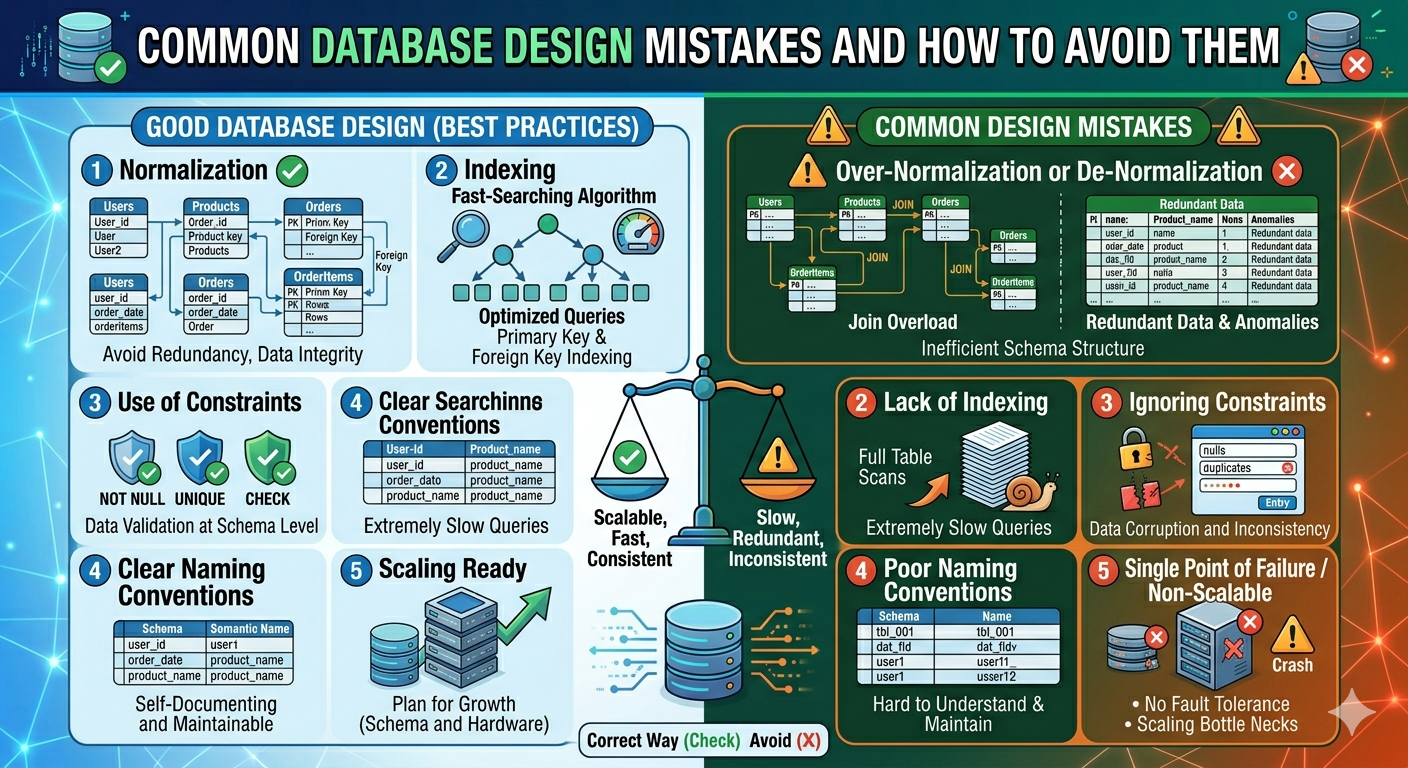
Reduces Design Errors
An ER diagram can be used to plan the database and identify potential issues before implementation begins. Missing relationships, duplicate entities, and incorrect assumptions can be identified early on in the design process. Fixing these issues during the planning stage saves significant time and effort over making changes after development has begun.
Improves Communication
ER diagrams serve as a standard visual language for developers, database administrators, designers, and business stakeholders. Even non-technical team members can understand the system's fundamental structure, making it easier to discuss requirements, validate business rules, and ensure that everyone has the same understanding of the database design.
Saves Development Time
A well-structured ER diagram serves as a roadmap for database implementation. It can be used as a guide by developers to create tables, define relationships, and set constraints. Because the structure has already been properly defined, there is reduced confusion, less rework, and a faster development process.
Supports Normalization
ER diagrams assist developers in organizing data logically and identifying chances to remove redundancy. By clearly displaying entities and their relationships, they make it easy to split data into suitable tables and apply normalization rules. This results in a more efficient database with higher data integrity and less redundancy.
A tangible, plainly recognized, and unrecognizable living or non-living entity. Anything within the company must be represented in our database. It could be a tangible object, a simple fact about the company, or an actual event that takes place.
An entity, which contains data in the database, might be a place, person, item, event, or concept. Entities must possess an attribute and a distinct key as part of their characteristics. Each "attribute" that makes up an entity serves to represent it.
Regular Entity

This is a powerful entity that isn't reliant on anything else. An employee, for example, is a regular entity in a database of employees.
Weak Entity

A weak entity is a kind of entity that lacks its primary attribute. By taking into account another entity's primary key, it can be uniquely identified. Participation from weak entity sets is required for it.
A property or characteristic of an entity is its attribute. Any number of attributes can be present in an entity. The primary key is regarded as one of the attributes. An ellipsoid shape is used to represent characteristics in an Entity-Relation model.
Simple Attributes

A simple attribute is an attribute that cannot be broken into other components.
Composite Attributes
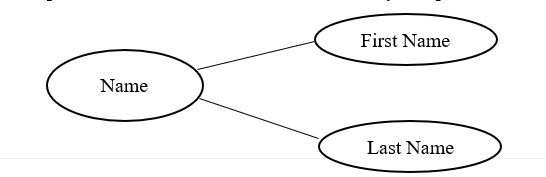
A composite attribute is an attribute that has many components.
Multi Value Attributes

A multi-valued attribute is one that stores multiple values for each instance of an entity.
For an example, A student might have multiple email addresses, mobile numbers, etc.
Derived Attributes

The physical database does not have this kind of attribute. Their values, however, are obtained from other database attributes that are present. Age, for instance, shouldn't be directly stored. Instead, it must be determined from the employee's DOB.
How entities relate to one another or interact with one another. You can think of relationships as verbs. For instance, the aforementioned student might enroll for a course. The link between the student and the course—two distinct entities—is implied by the enrolment process. Diamonds or labels on the connecting lines are typically used to indicate relationships.
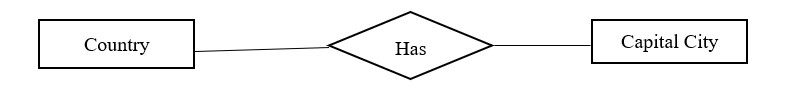
One to One Relationship
A record in one entity (table) is linked to exactly one record in another entity(table) in this relationship.
For an example one country has exactly one capital city and one capital city has a one country.
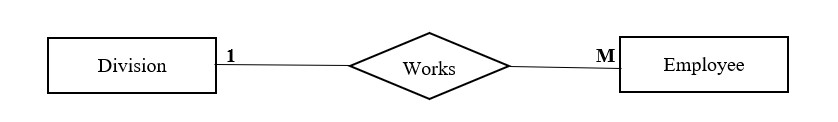
One to Many Relationship
When one entity interacts with another, this relationship occurs frequently; for example, one employee may only work for one division. However, one division has many staff.
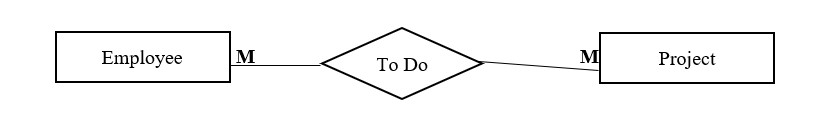
Many to Many Relationship
This relationship happens when two entities interact with each other multiple times in a single instance. For example, one employee can work on multiple projects, and multiple employees can work on a single project at any given moment.
Each record in a relational table is uniquely identified by its primary key. Keys are used in databases to compare, classify, and store records as well as to establish relationships between them.
The referring table with a foreign key is referred to as a child table, while the original table is referred to as the parent table or referenced table.
Why ER Diagrams Are Important
MySQL Workbench, Lucidchart, draw.io, and Microsoft Visio are among of the tools used by developers to create ER diagrams, which make it easier to design and share database structures.
ER diagrams are a critical part of database design because they help visualize and structure data effectively. They break down complex systems into entities, attributes, and relationships, making it easier for developers to plan and implement databases.
ER diagrams help engineers reduce errors, increase communication, and construct scalable, well-organized systems. Whether you work on small apps or large enterprise systems, understanding ER diagrams is critical for effective database design and software development.
Frequently Asked Questions
Trending Now

Recent Posts

Beginner's Guide to Software Development: Everything You Need to Know in 2026
May 30, 2026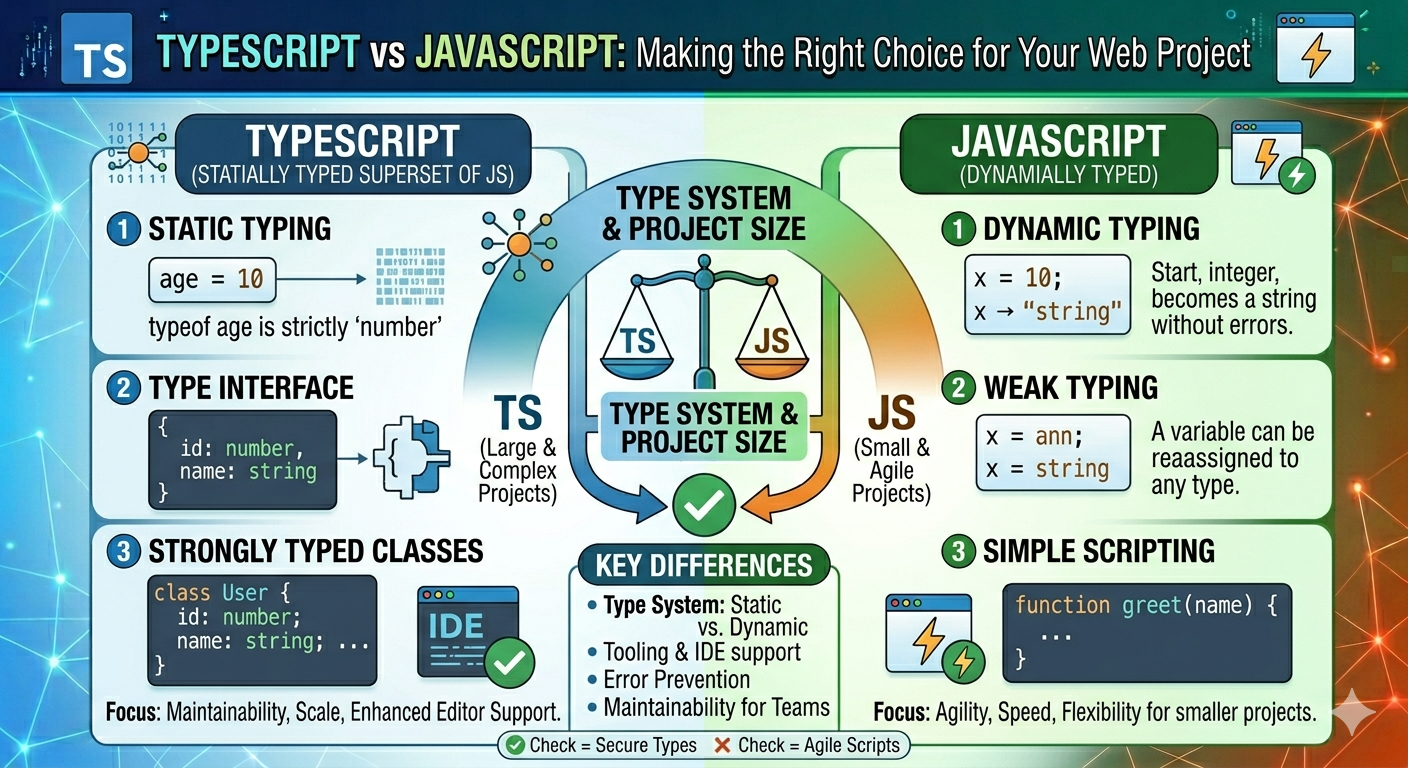
TypeScript vs JavaScript - Key Differences
May 04, 2026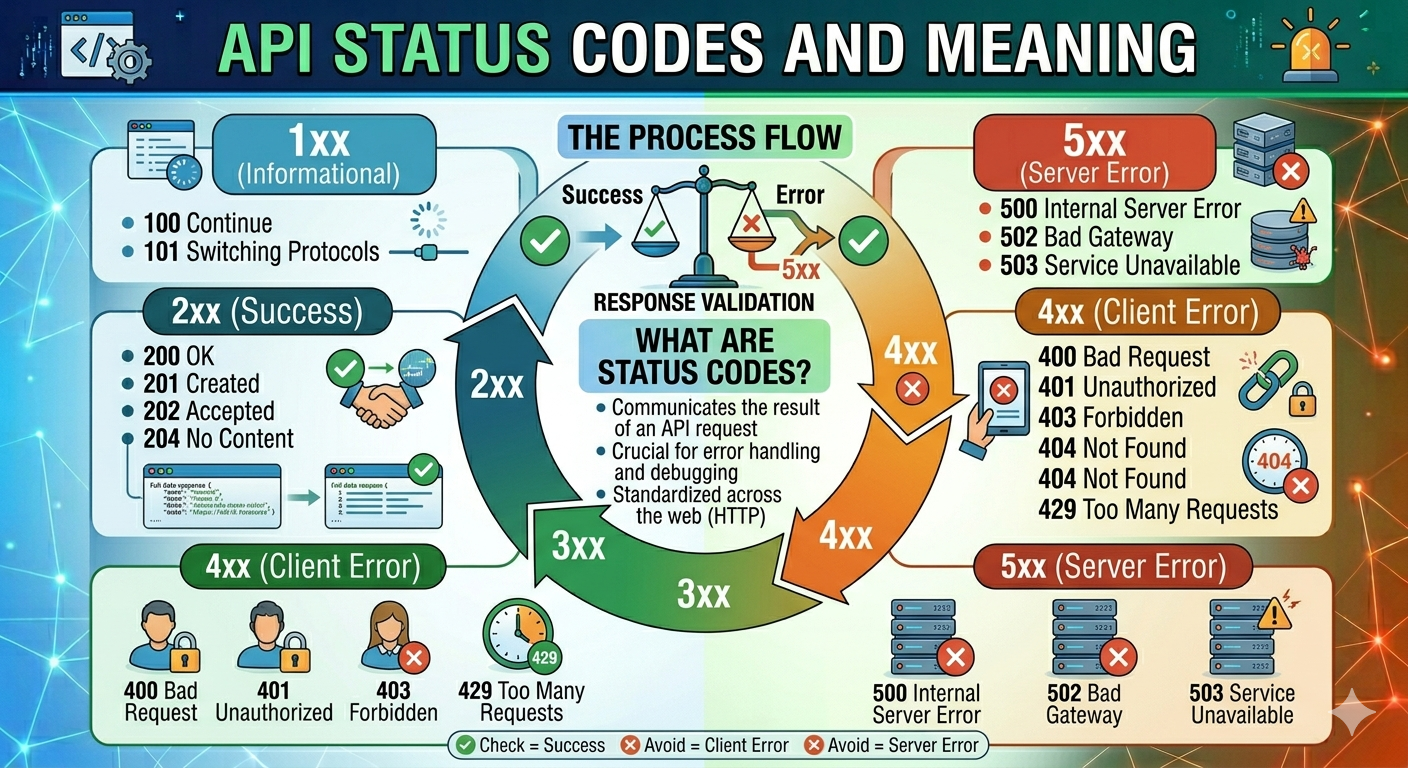
API Status Codes & Meanings
May 04, 2026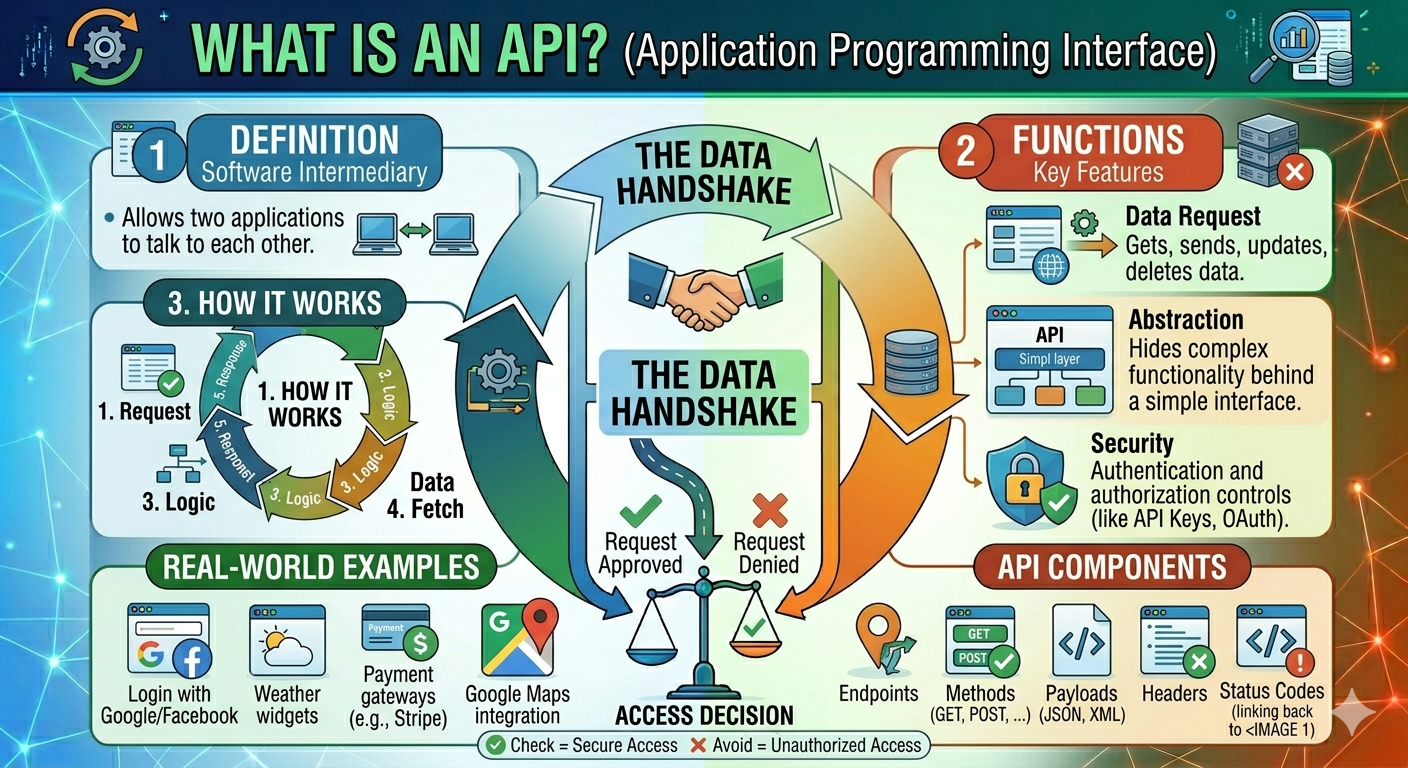
What is an Application Programming Interface (API)
May 04, 2026
Network Security Basics – Threats & Protection Methods
May 04, 2026