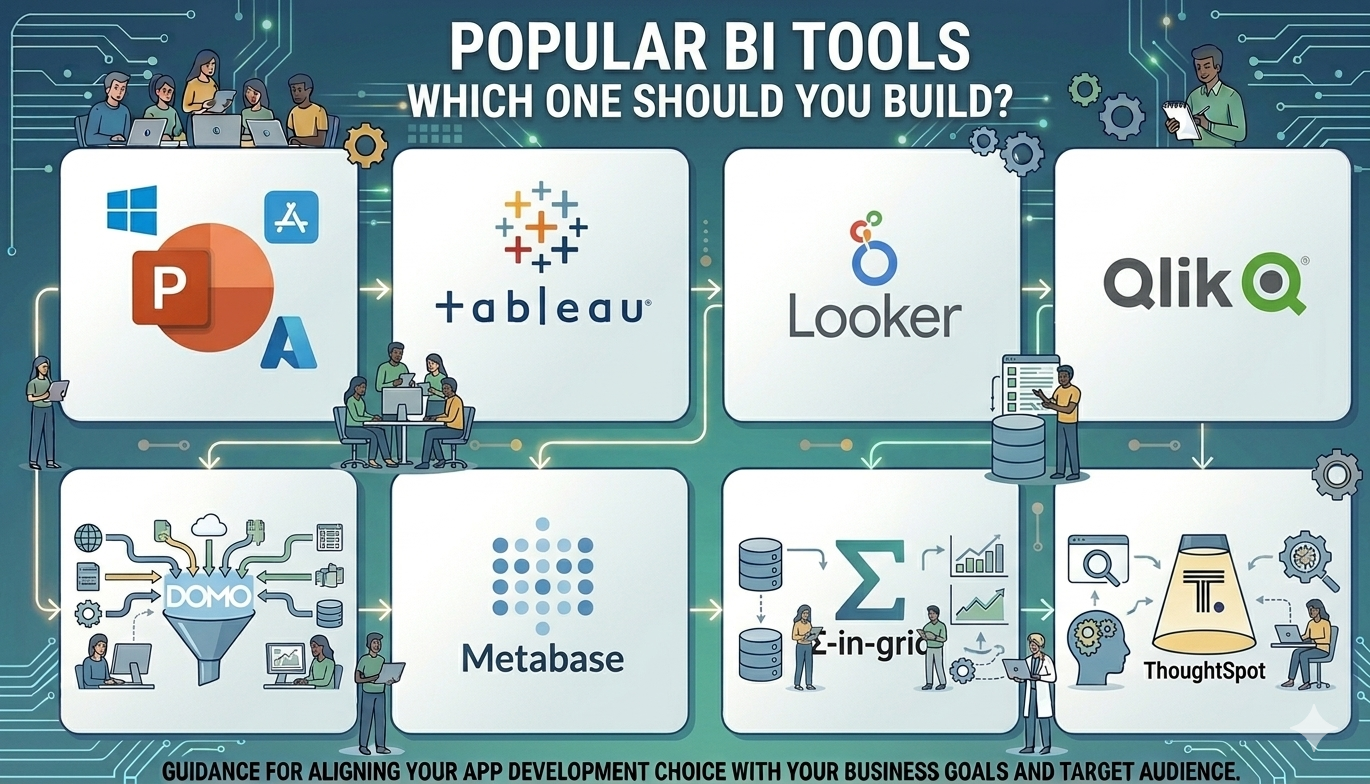
Popular BI Tools
In today’s data-driven world, businesses rely heavily on insights to make smarter decisions. This is where Business Intelligence (BI) tools play a crucial role. BI tools help organizations collect, analyze, and visualize data to uncover trends, improve performance, and drive growth.
Selecting the right Business Intelligence (BI) tool is essential for turning company data into a competitive advantage. In 2026, the market is dominated by platforms that prioritize AI integration, cloud-native scalability, and user-friendly "self-service" interfaces. Also, now startups to large enterprises, companies use BI tools to transform raw data into meaningful insights.
In this article, we’ll explore the most popular BI tools, their features, and how they help businesses succeed.
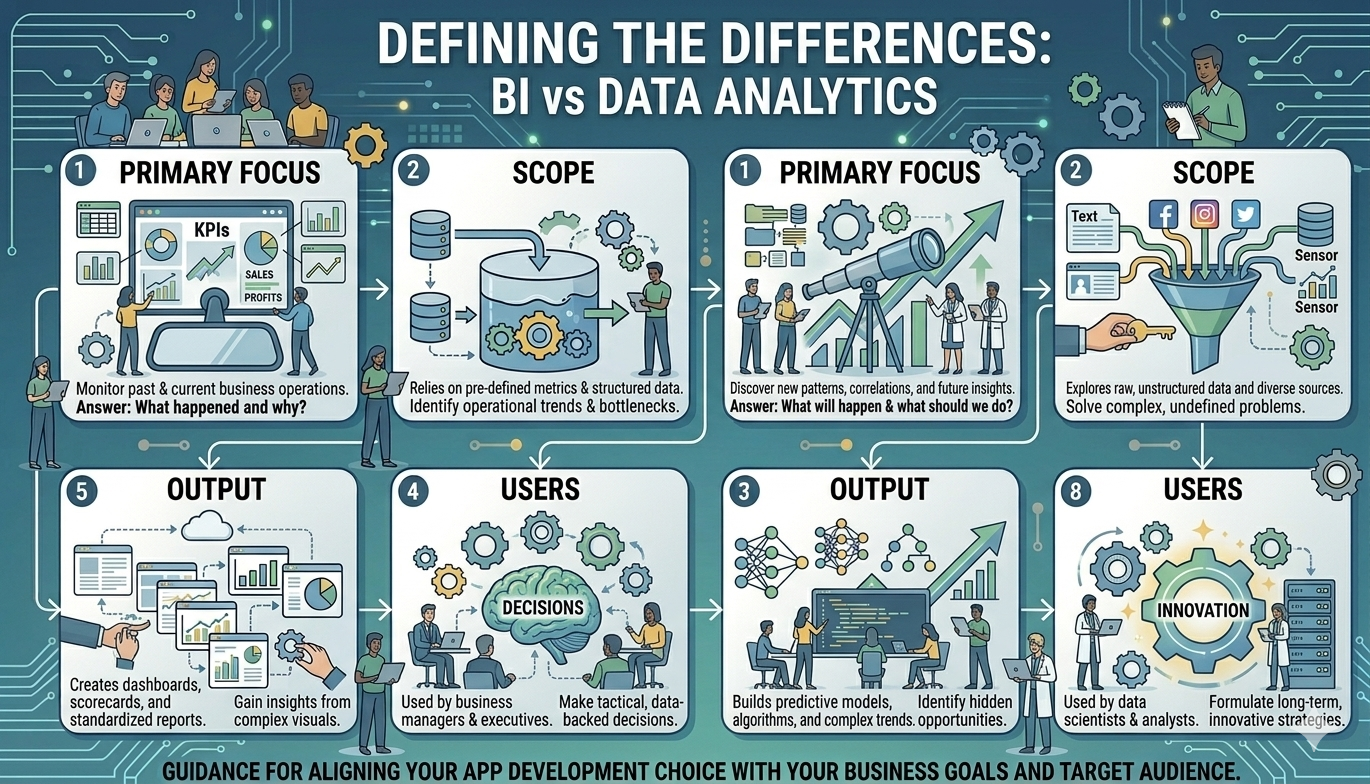
What Are BI Tools?
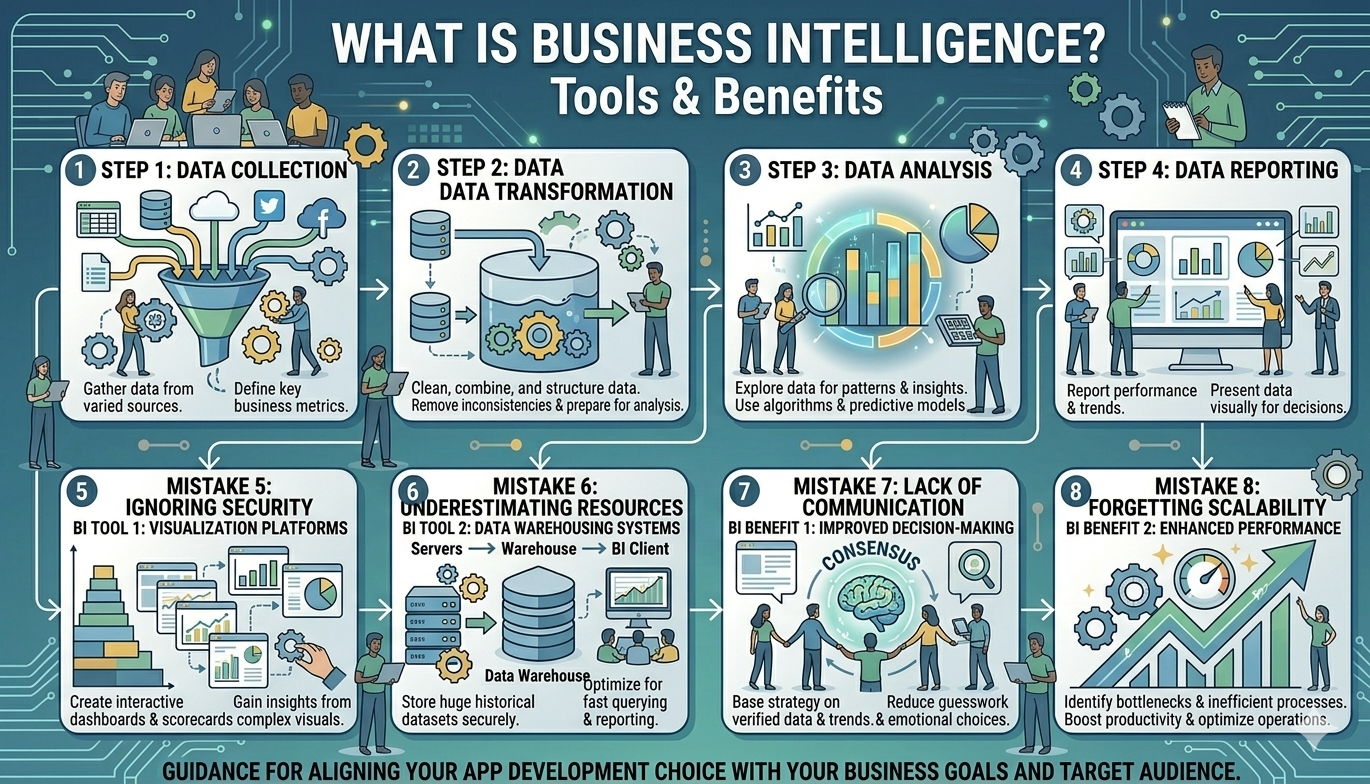
Software applications that analyze data and provide actionable data are known as business intelligence (BI) tools. With the aid of these tools, users can produce dashboards, reports, and visualizations that simplify complex data.
Key Functions of BI Tools
Data collection and integration
Data analysis and processing
Visualization (charts, graphs, dashboards)
Reporting and sharing insights
Real-time data monitoring
Why Are BI Tools Important?
BI tools are essential for modern businesses because they:
Enable data-driven decision-making
Improve operational efficiency
Identify trends and opportunities
Enhance customer insights
Provide real-time analytics
Popular BI Tools
Microsoft Power BI
Power BI is a leading business intelligence tool renowned for its strong data visualization capabilities and integration with Microsoft products. Holding over 23% of the market share, it is the preferred option for companies already using the Microsoft ecosystem, affirming its position as a market leader in the BI industry.
Key Features
Interactive dashboards
Real-time data updates
Integration with Excel and Azure
AI-powered insights
This is best for Small to large businesses using Microsoft ecosystem (like Microsoft 365, Azure, and Excel).
Some of the benefits of this are that it is cheap to get into, has a lot of community support, and has an interface that is very easy to use. And the drawbacks are that performance can slow down with very large datasets unless you use premium capacity.
Tableau
Tableau is recognized for its advanced data visualization capabilities and its intuitive interface, positioning itself as the gold standard for premium data visualization and in-depth exploratory analysis.
Key Features
Drag-and-drop interface
Advanced analytics
Interactive dashboards
Strong community support
This is best for data analysts who need complex, highly customized visualizations.
Some benefits of this are that it has unmatched visual flexibility and can easily handle large, diverse datasets. And higher costs and a more difficult learning curve for non-technical users are drawbacks.
Google Looker Studio
Previously known as Google Data Studio, Looker Studio is a tool designed for creating sharable reports and dashboards. Google provides two options: Looker, which is focused on enterprise governance, and Looker Studio, which allows for quick and free reporting.
Key Features
Free to use
Easy integration with Google services
LookML (a powerful modeling language)
Real-time collaboration
Native BigQuery integration
Massive library of free templates
Customizable dashboards
This is best for companies on Google Cloud (GCP) or those needing a "single source of truth."
Advantages of Looker include centralized metric definitions that prevent data drift and its 100% web-based nature. However, disadvantages are that LookML requires coding knowledge, and Looker Studio may feel limited for complex enterprise needs.
Qlik Sense
Qlik Sense employs an associative data model, enabling users to explore data freely, which is a distinct advantage over traditional query-based tools. Its Associative Engine highlights relationships between data points that might otherwise remain obscured.
Key Features
Self-service analytics
AI-powered insights
Interactive visualizations
Data discovery capabilities
Associative data indexing
This is optimal for organizations requiring flexible data exploration, particularly in uncovering "hidden" insights within complex, messy data.
Advantages include very fast data exploration and suitability for non-linear thinking, while disadvantages involve the complexity of mastering proprietary logic compared to SQL-based tools.
Sisense
Sisense is known for its ability to handle large datasets and embed analytics into applications.
Key Features
Embedded analytics
High-performance data processing
Custom dashboards
API integration
This is best for Developers and product teams as well.
IBM Cognos Analytics
IBM Cognos offers AI-assisted analytics and enterprise reporting capabilities.
Key Features
AI-powered insights
Dashboard creation
Data storytelling
Strong security features
This is best for large organizations requiring secure BI solutions.
Business Intelligence tools have become essential for organizations looking to stay competitive in a data-driven world. Whether you are a small business or a large enterprise, choosing the right BI tool can significantly improve your decision-making and overall performance.
Frequently Asked Questions
Trending Now
Recent Posts
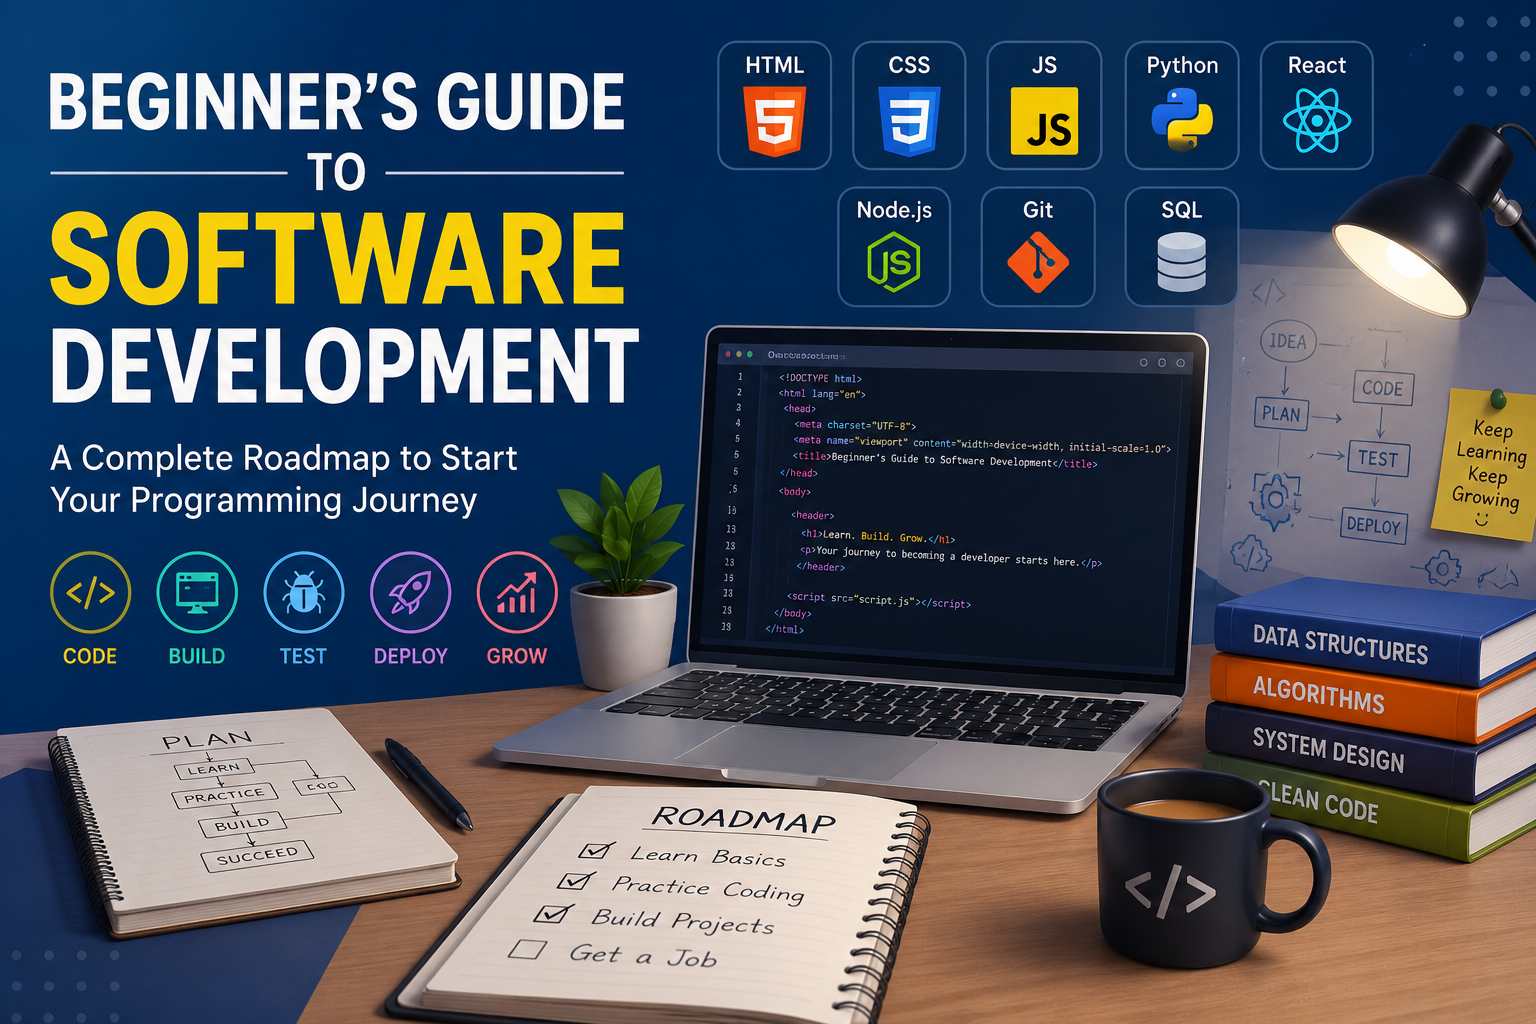
Beginner's Guide to Software Development: Everything You Need to Know in 2026
May 30, 2026
TypeScript vs JavaScript - Key Differences
May 04, 2026
API Status Codes & Meanings
May 04, 2026
What is an Application Programming Interface (API)
May 04, 2026
Network Security Basics – Threats & Protection Methods
May 04, 2026